3 Land use changes and trajectories
3.1 Description
Pre-QuES (Preliminary Quantification of Ecosystem Services) is a land use change assessment module that provides key information to identify potential drivers of land use change. This analysis quantifies land cover types and their changes over time, identifies specific land use change trajectories, breaks down changes by administrative or planning units, and visualizes land use dynamics through maps and Sankey-charts.
3.2 Usage
3.2.1 Workflow

Data Preparation
Before using the Pre-QuES Analysis tool, prepare the following:
• Land Cover Maps: Two raster files (GeoTIFF format) representing land use/cover for two different time points (T1 and T2)
• Planning Unit Map: A raster file (GeoTIFF format) or shapefile of administrative or management zones.
• Land Use/Cover Lookup Table: A CSV file describing raster values with their corresponding land cover classes.
• Planning Unit Table: A CSV file describes raster values with their corresponding planning unit classes. This file is required only if the planning unit map is in raster (GeoTIFF) format. • Trajectory Rules: A CSV file defining rules for classifying land use change trajectories
3.2.2 Step-by step instructions
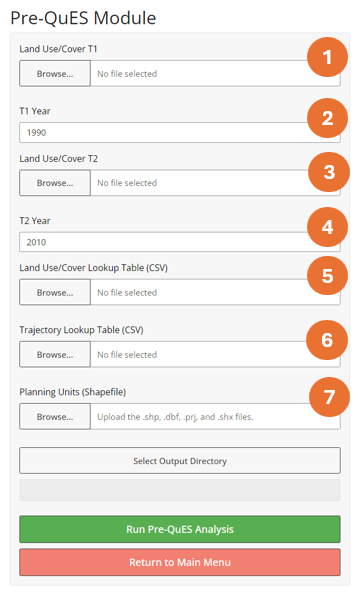
Step 1: Uploading Data
Follow these steps to use the tool:
1. Land Use/Cover T1
Click “Browse” and select your land cover raster file for the first time point (T1).
2. T1 Year
Enter the year corresponding to the T1 land cover data.
3. Land Use/Cover T2
Click “Browse” and select your land cover raster file for the second time point (T2).
4. T2 Year
Enter the year corresponding to the T2 land cover data.
5. Land Use/Cover Lookup Table Click “Browse” and select your prepared CSV file containing the land cover classification scheme.
6. Planning Units
Input Type Select either “Raster” or “Shapefile” for your planning unit data.
7. Planning Units
Click “Browse” and select your planning unit raster or shapefile.
8. Planning Units Lookup
If using a raster, click “Browse” to select a CSV file with planning unit classifications.
9. Trajectory Rules
Click “Browse” and select your CSV file defining trajectory rules.
10. Output Directory
Click “Select Output Directory” to choose where results will be saved.
11. Run Analysis
Click “Run Pre-QuES Analysis” to start the process.
Step 2: Setting Analysis Parameters
Step 3: Running the Analysis
3.2.3 Tips
3.3 Data Requirements
Before conducting an analysis using the Pre-QuES module, users are required to prepare:
- Land cover data at a minimum of two different points in time.
- Other spatial data used is a spatial allocation map that is compiled based on the agreement of the parties in the use of regional space.
- Some data that can be used to represent this planning unit data such as area designation, spatial planning, Watershed Area (DAS), administration, or overlay of several permit data that have been issued.
- In addition to spatial data, other input data required are land cover/land use type attribute data and attribute data from its planning unit class. This data is prepared in comma delimited (csv) file format
3.3.1 Input Data and Parameters
3.3.2 Example Datasets
3.3.3 Data Acquistion
3.4 Outputs
3.4.1 Accessing Outputs
After the analysis completes, you’ll find the following in your selected output directory:
Pre-QuES Land Use Change Transition Table: A CSV file detailing land cover transitions between T1 and T2.
Change Trajectory Map: A GeoTIFF file illustrating spatial patterns of land use change trajectories.
Forest Change Trajectory Map: A GeoTIFF file showing forest-specific change patterns (e.g., deforestation, degradation).
Pre-QuES Report: An HTML file providing a comprehensive overview of the analysis results, including:
Land cover composition tables and graphs
Sankey diagrams of land use dynamics
Top land use changes at landscape and planning unit levels
Trajectory analysis results and visualizations
These outputs will help you understand land use change patterns, identify potential drivers of change, and inform land use planning and management decisions.
3.4.2 Output Files
| File Name | Type | Description |
|---|---|---|
| land_use_change_map_[PreQuES_ChangeTrajectory].tif | Raster | Map depicting changes in land use between the specified time periods. |
| transition_matrix_[PreQuES_luc_change_transition_table ].csv | CSV | Table showing the area of land that transitioned between each land use category. |
| PreQuES_ChangeTrajectory_map.tif.aux.xm | xmlfile | |
| transition_matrix_[PreQuES_ChangeTrajectory_lookup].csv | CSV | Table showing the area of land that transitioned between each land use category. |
| [PreQuES_report].html | HTML | A report summarizing the analysis results with visualizations and tables. |
3.4.3 Report Interpretation
Pre-QUES Land cover change analysis or land cover change analysis is carried out to determine the tendency of land cover changes in an area over a period of time. This analysis is carried out using land cover map data at two different time periods. In addition, by entering planning unit data into the analysis process, the tendency of land cover changes in each existing planning unit class can be identified. The information generated through this analysis can be used in the planning process for various things. Among them are: determining development priorities, knowing the factors that trigger changes in land use, planning future development scenarios, etc.
