Scenario Builder
1. Description
The Scenario Builder module within LUMENS allows policymakers or planners to simulate and analyze potential future land use and cover changes based on different scenarios. The module specifically provides information on net emission offsets (CO2eq) by comparing baseline emissions with scenario projections. This allows policymakers to assess the effectiveness of different strategies in reducing greenhouse gas emissions and achieving climate goals.
Policymakers face challenges such as balancing economic development with environmental conservation, mitigating climate change impacts, and ensuring food security; with development pressures continuing to reduce the availability of productive land. The Scenario Builder module supports decision-making by analyzing historical trends, forecasting outcomes under different land-use policies, and providing net emission offset data.
2. Usage
2.1 Workflow
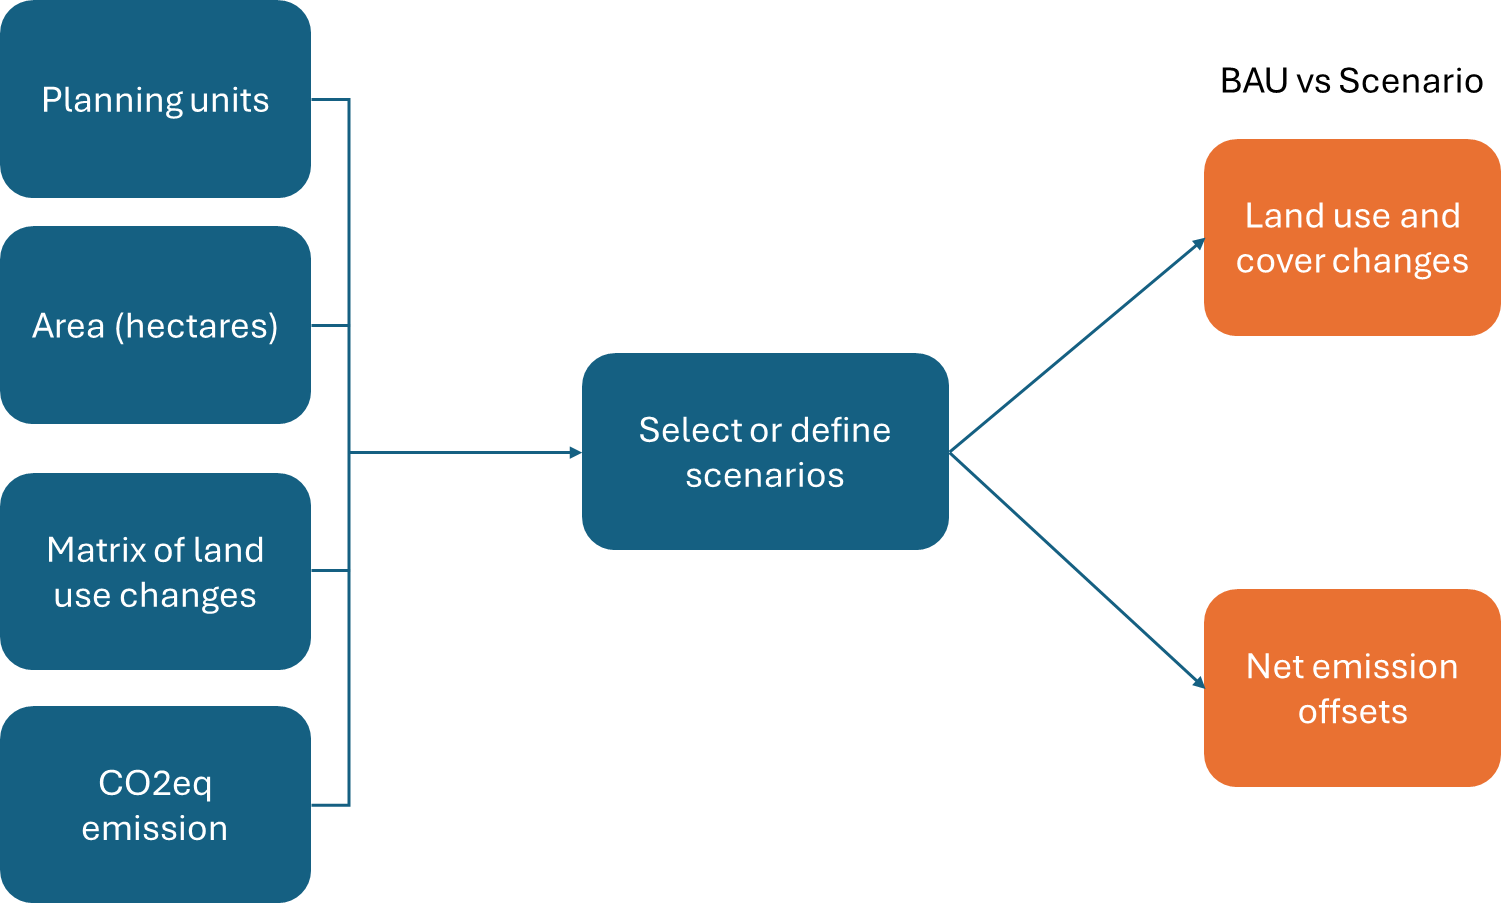
Users start by uploading the QUES-C database, which includes essential data such as planning units, the corresponding year, area (in hectares), and the matrix of land use change. Then, select or define various scenarios based on development policy, conservation efforts, economic development strategies, or plans. The module processes the input data and selected parameters to simulate land use and cover changes over time. It generates comprehensive maps and statistics that detail land use changes across different planning units, along with net emission offsets (CO2eq) under different scenarios.
2.2 Step-by-step instructions Step 1: Uploading QUES-C Database

Load QUES-C Database
- Navigate to the “Data” tab in the main interface of the Scenario Builder module.
Click the “Browse” Button:
Select the “Browse” button to begin importing your QUES-C database. The file should be in CSV format.
After selecting your file, click “OK” to upload the data. The system will notify you once the upload is successful.

Select output directory where results will be saved, Click ‘+’ to save and Select.
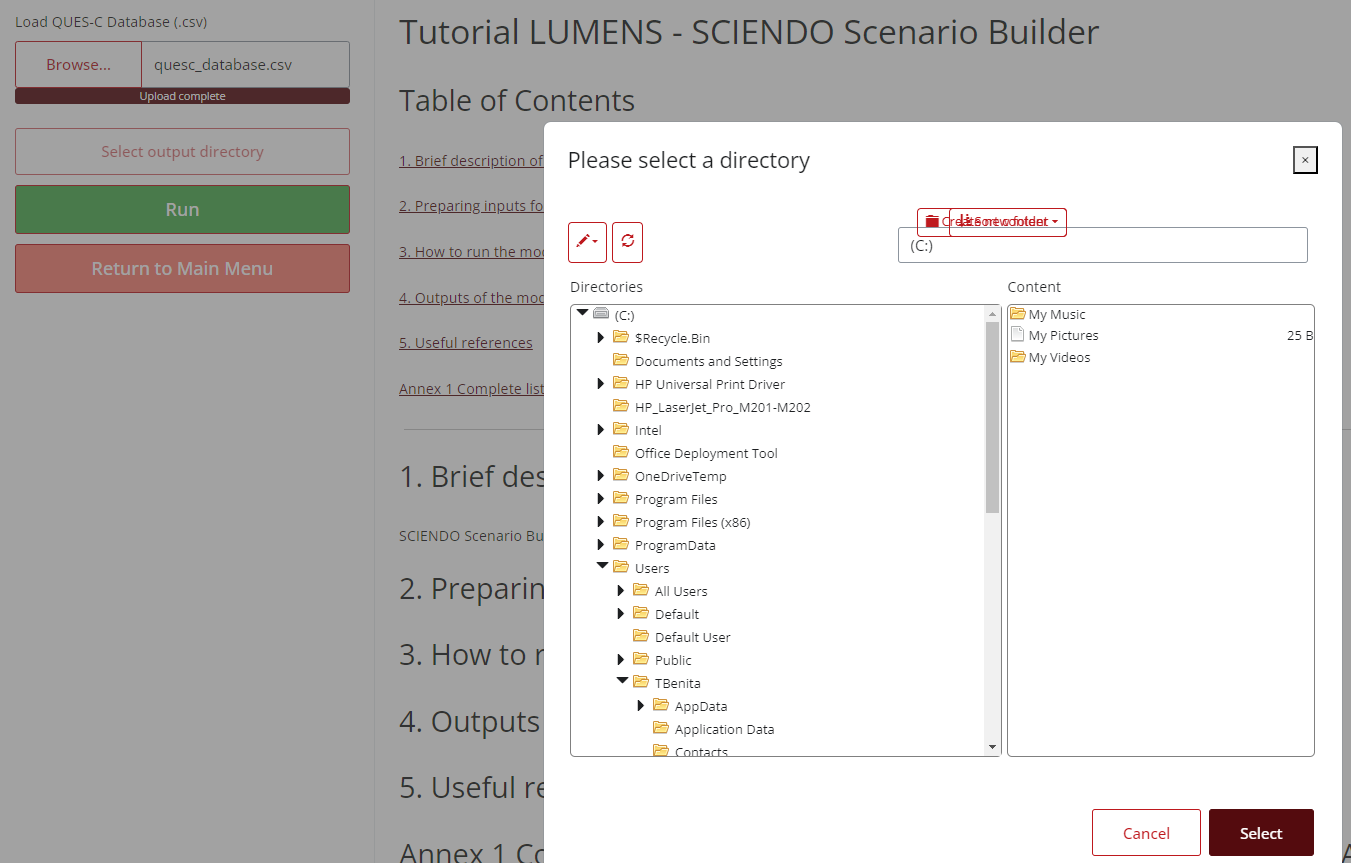
Once the directory has been selected, click on the tab ‘Projection’ on the top menu panel.
Step 2: Select and Define Scenario
Navigate to the “Projection” Tab:
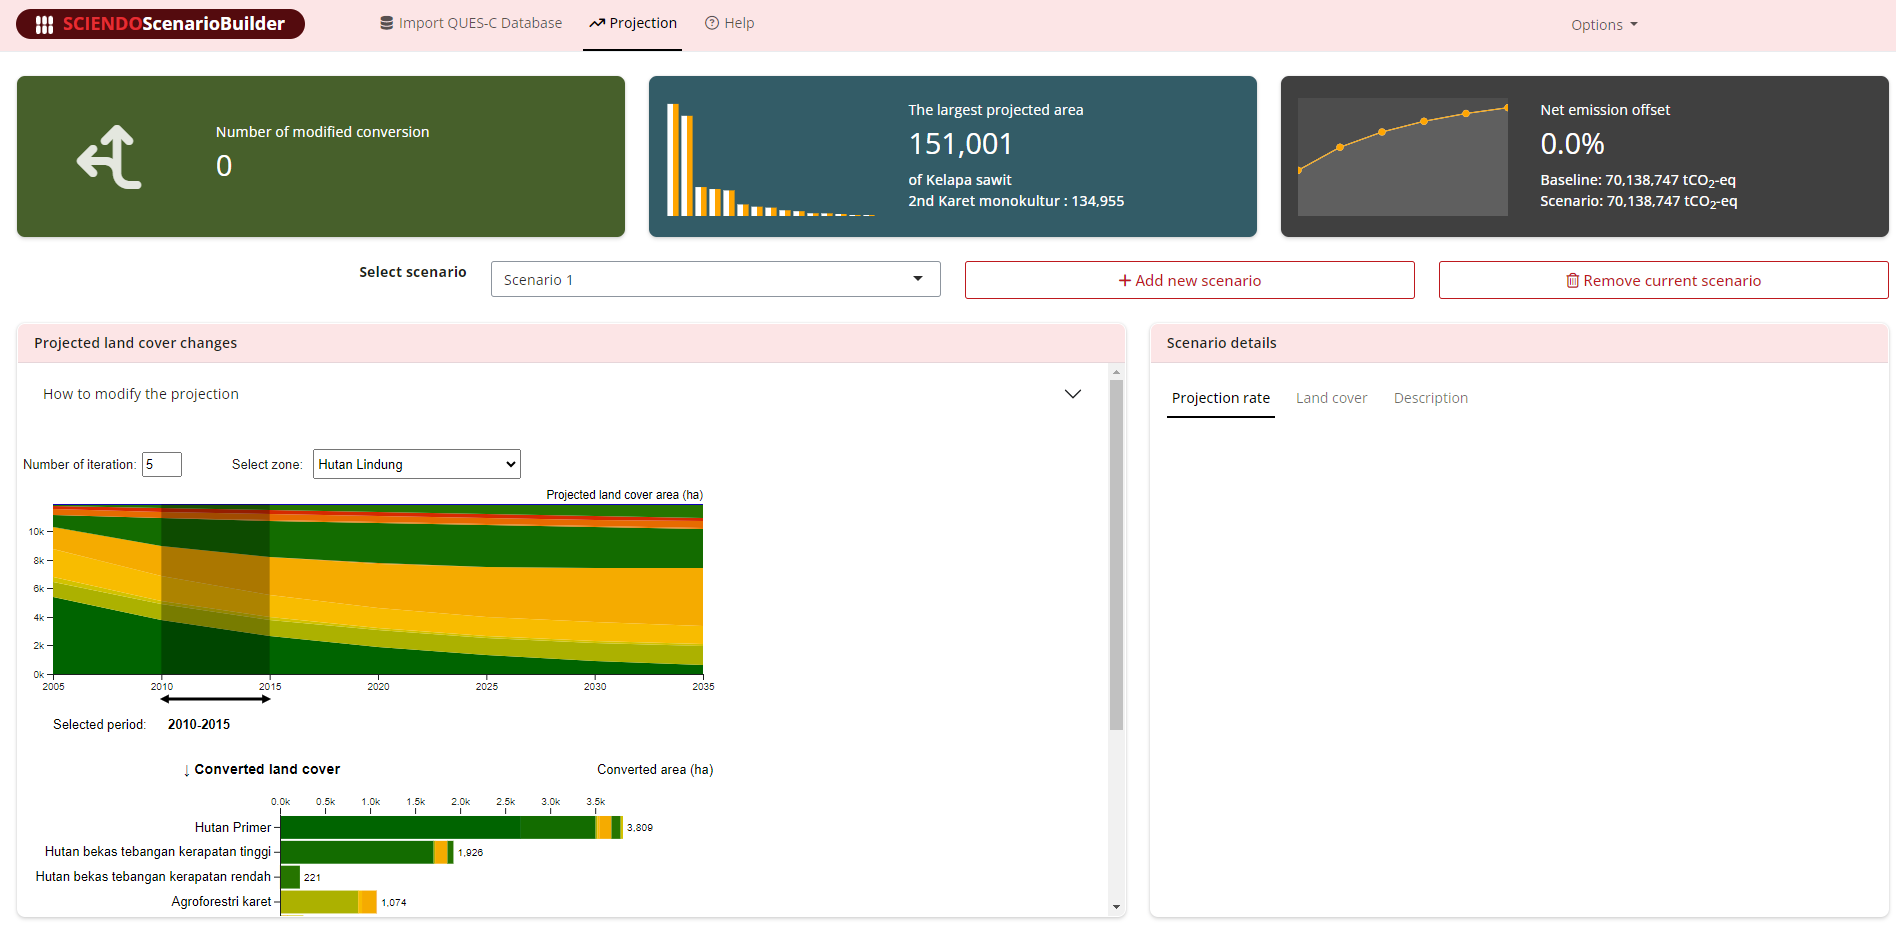
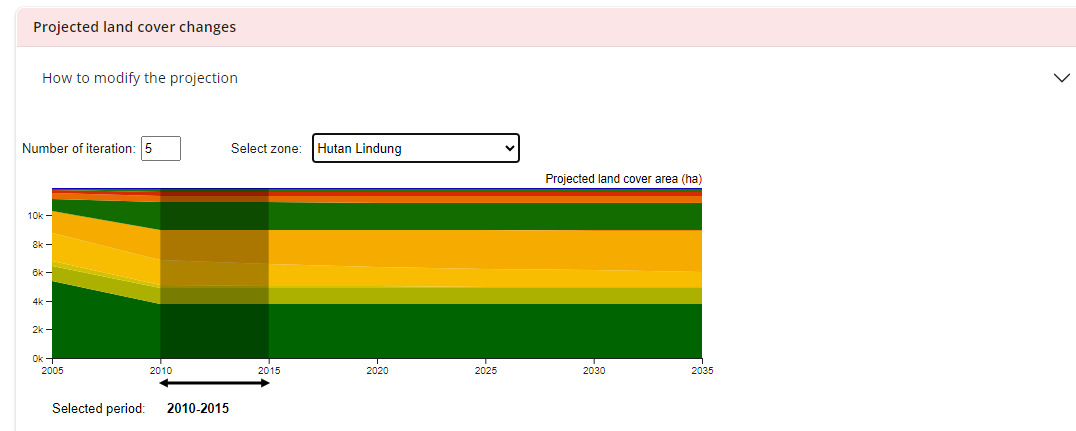
Users can begin defining the specific land use change scenarios for analysis. Select the period by clicking the horizontal year axis on the area chart. In this exercise, we will use 2010-2015. Users can define the name of the scenario by clicking on ‘Description’ located inside the ‘Scenario details’ box on the right hand side of the screen. For instance Scenario 1 and change it to Baseline Scenario as reference.
Baseline Scenario:
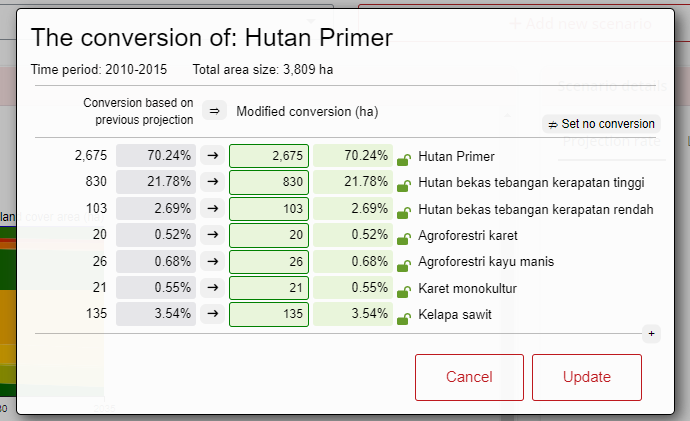
- Baseline scenario represents the current land use conditions and will be used as the reference for comparing future changes. We can see that under baseline scenario, some areas in primary forest (hutan primer) converted to other land uses, including rubber and oil palm. For instance, in the example below, it is shown that areas labelled as primary forest consists of only 70,24% actual primary forest, while the rest have been converted into 21,78% high density logged forest (hutan bekas tebangan kerapatan tinggi), 3,54% oil palm, 2,69% low density logged forest, and the rest include monoculture rubber, and rubber and cinnamon agroforestry.
Under the baseline scenario, indicated above for areas labelled primary forest, areas with the largest projected areas are oil palm, followed by monoculture rubber. This will contribute to an increase of net emission which is about 70 million tCO2-eq.

Define Alternative Scenarios:
Add and describe the different land use change scenarios based on alternative policy interventions or development trajectories. Each scenario should outline changes in land use such as deforestation, agricultural expansion, or conservation efforts. Example of set scenarios are as follows:
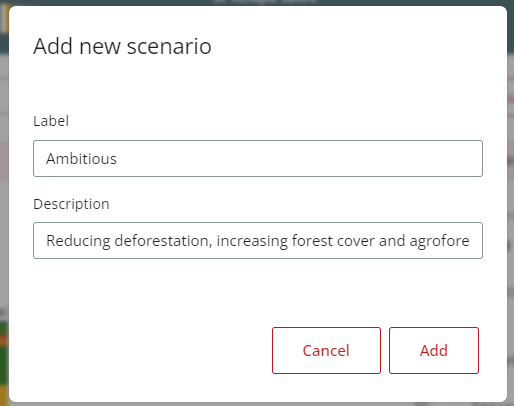
a. ambitious scenario
This scenario aims to reduce deforestation. It simulates a series of land use changes designed to enhance sustainability. Specifically, all conversions from natural forest to non-natural forest are entirely prevented, and no primary forest areas are allowed to be converted to other land uses.
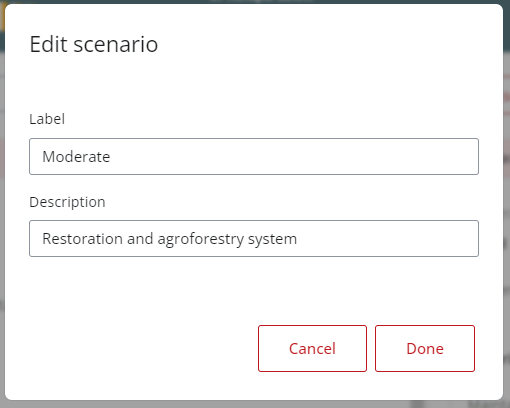
b. moderate scenario
This scenario focuses on any changes from primary forest to other land covers are halted, while forest covers are actively expanded through planting efforts. Monoculture plantations, such as rubber and oil palm, are transitioned into agroforestry systems, and some areas of open land are also converted to agroforestry, supporting biodiversity and sustainable land management.
Modify the projection areas based on defined scenario
For instance, in ambitious scenario, all conversions from natural forest to non-natural forest are entirely prevented.
Select “zone”, here users will find the planning units.
Click the converted land cover graph to see the baseline result as follows.
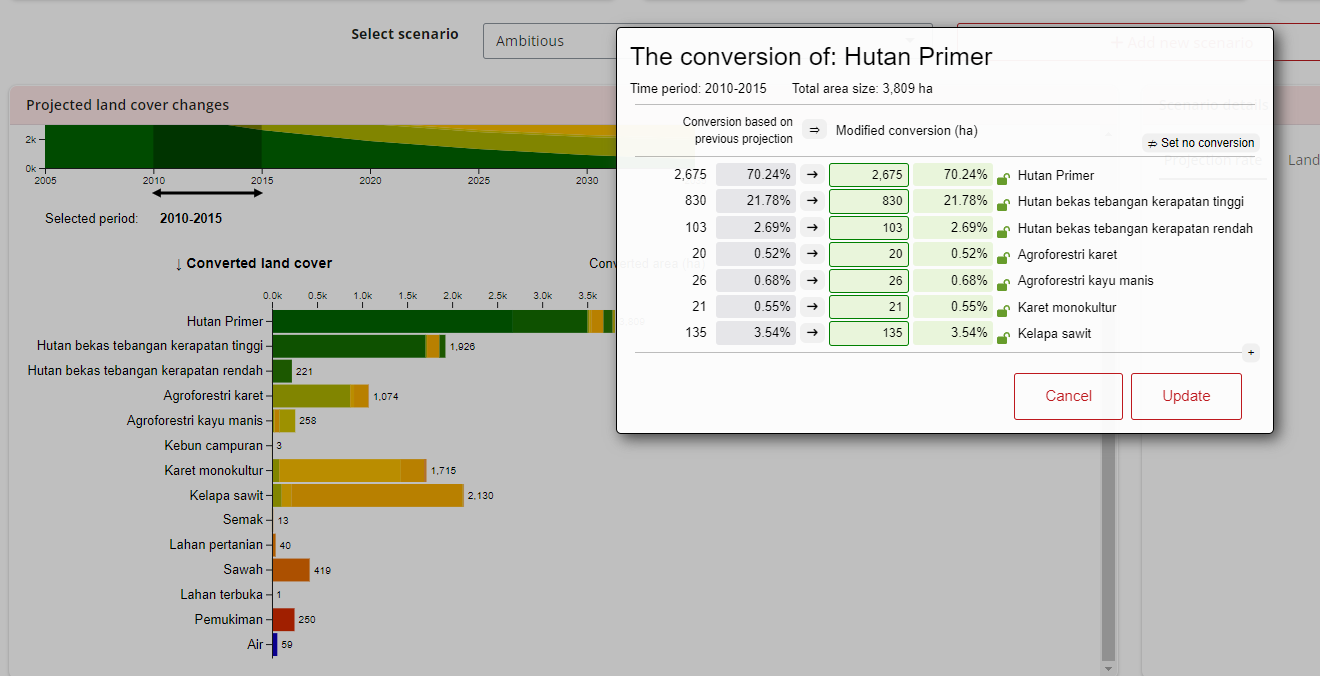
Change the all modified conversion into “0” which means there will remain primary forest.
The result should look like this and click “Update”.
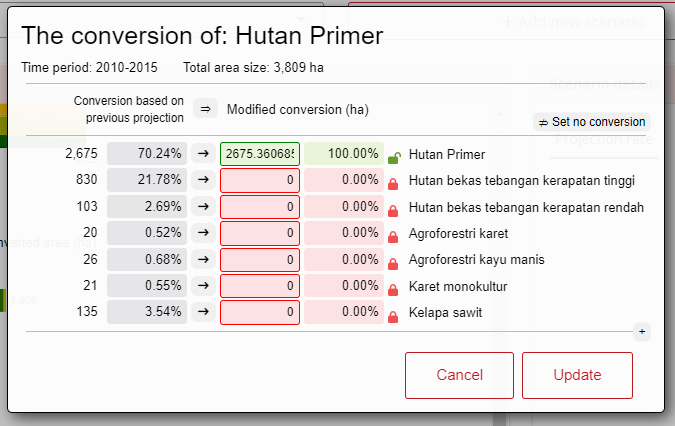
Do the projection changes to other zones that have “hutan primer” (primary forest)
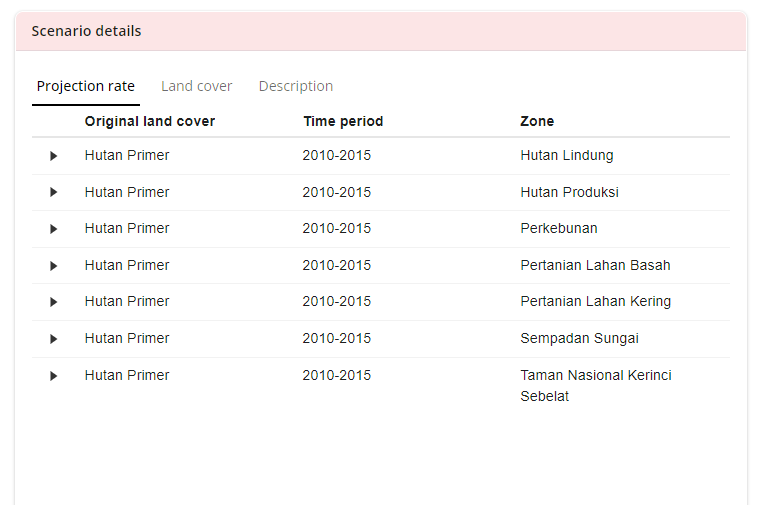
On the bottom right of the page, users will see the scenario details as follow.
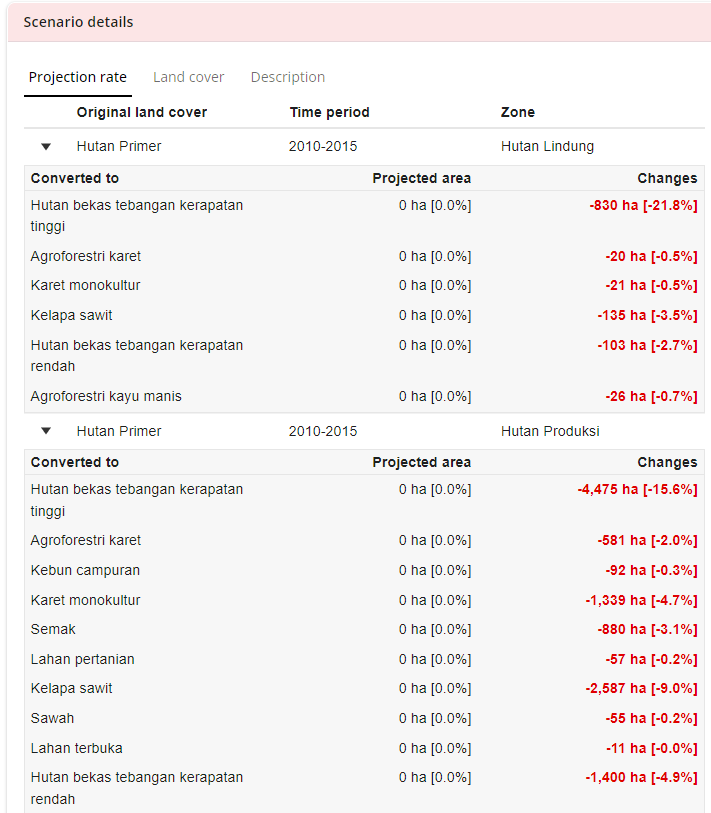
- Monitor Emission Changes:
As you define each scenario, you can observe gradual changes in net emissions (CO2eq) in the summary provided at the bottom right of the page. This helps in understanding the long-term impact of land use decisions on emissions. For example from the ambitious scenario below.

It means that in between 2010-2015, changes of projected area has contributed to the net emission offset for about -36.8 per cent. The resume box shows below that it reduce almost half of the baseline by implementing the ambitious scenario. Users may hover over the graph to see detailed net emission offsets of the baseline and alternative scenario.
- Run Analysis, and Download Parameters and REDD Abacus Data:
- Once scenarios are defined, click on ‘Run Analysis’. Users can then download the selected parameters and REDD+ Abacus data for further analysis or reporting purposes.
Step 3: Compare and Interpret Results:
Compare the baseline scenario with the alternative scenarios to evaluate the effectiveness of each strategy in reducing emissions and managing land use change. The detailed outputs help assess impacts and guide decision-making.
2.3 Tips
- For large datasets, the analysis may take some time to complete.
- Users cannot open two modules or more at the same time.
3. Data Requirements
3.1 Input Data & Parameters
| No | Data Name | Type | Format | Projection Requirements | Description |
|---|---|---|---|---|---|
| 1. | QUES-C Database | Categorical, numerical | CSV | N/A | Planning unite, land use change matrix, carbon values (CO2eq) per land use type. |
3.2 Example Datasets
[Example data sets can be accessed in link.]
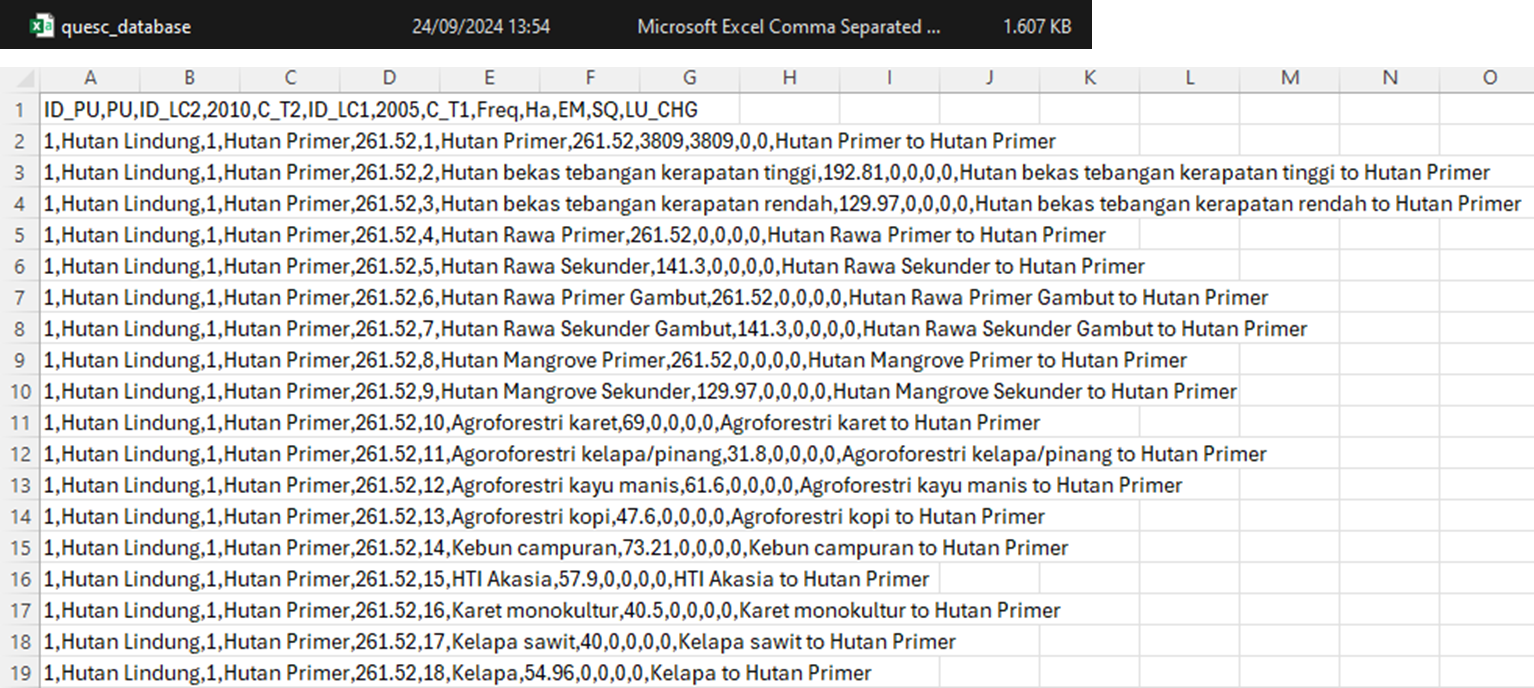
3.3 Data Acquisition
4. Outputs
4.1 Output Files
| File Name | Type | Description |
|---|---|---|
transition_matrix_[SUFFIX].csv |
CSV | Table showing the area of land that transitioned between each land use category. |
report_[SUFFIX].html |
HTML | A report summarizing the analysis results with visualizations and tables. |
4.2 Report Interpretation
In comparing the baseline scenario with the alternative scenarios, the effectiveness of each strategy in reducing emissions and managing land use change becomes evident.
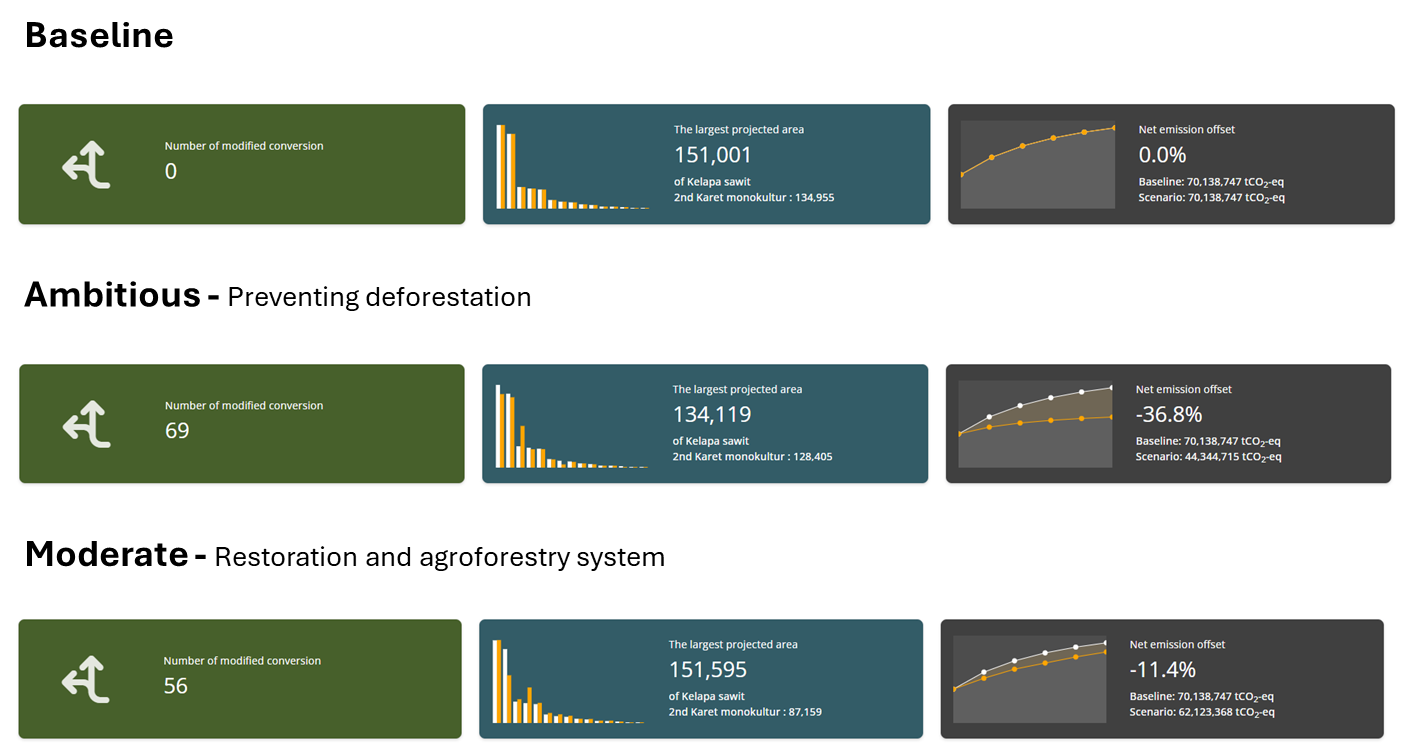
The Ambitious Scenario is the most effective in reducing emissions, with a 36.8% reduction, achieved through complete protection of primary forests and prevention of land conversion.
The Moderate Scenario provides a more balanced approach, achieving an 11.4% reduction in emissions by protecting forests and introducing agroforestry while allowing for limited expansion of plantations.
The Baseline Scenario, with no additional protections, results in the largest emission output, offering no improvement in sustainability.
5. Theoretical Background
5.1 Model Description
[The Scenario Builder operates based on a land use change simulation model, borrowing from previous tools on REDD+ ABACUS. Conceptually, the model works by comparing historical and projected land cover maps, identifying transitions between land use categories, and assessing the resulting impacts on emissions. The underlying approach is a change detection method, where changes between land cover types are monitored between different time periods. The module evaluates the extent of land conversion (e.g., from forest to plantation or settlement) and calculates the corresponding net emissions offset (CO2-eq).
The model generates results by integrating the land cover maps with defined planning units and linking the observed land use changes to emissions calculations. By simulating different scenarios (ambitious, moderate, and conservative), the module helps users compare alternative development strategies and their respective impacts on deforestation, forest cover, and agroforestry adoption.
5.2 Key Assumptions
The land cover maps used in the model accurately depict the current state of land use and are representative of the planning units being analyzed.
The model assumes that land use changes occur in a linear fashion over the analysis period, meaning that changes progress consistently without sudden large shifts or reversals.
Each planning unit is assumed to be homogenous in terms of land cover and land use activities. Transitions within the unit are treated as uniform, without internal variability.
The drivers behind land use changes, such as economic conditions or policy interventions, are considered static or predetermined for the duration of the scenario, with no dynamic interaction between the drivers and land use changes.
5.3 Limitations
The accuracy of the results is highly dependent on the resolution and quality of the input land cover maps. Low-resolution maps or inaccurate classifications may lead to errors in detecting land use changes and calculating emissions.
The model does not account for subtle, gradual changes within a single land use category (e.g., forest degradation that does not lead to immediate conversion). Only clear transitions from one land use category to another are captured.
References
[@article{dewi2023integrating, title={Integrating relational and instrumental values of nature in planning land use for multiple ecosystem services (LUMENS): tools and process}, author={Dewi, Sonya and Mulia, Rachmat and Johana, Feri and Ekadinata, Andree and van Noordwijk, Meine}, journal={Current Opinion in Environmental Sustainability}, volume={64}, pages={101333}, year={2023}, publisher={Elsevier} }]
