8 Land Use Change Modelling using DINAMICA
8.1 1. Description
The Land Use Change Modelling using Dinamica module in LUMENS simulates future land use/cover changes using a time and space model. It incorporates variables such as elevation, proximity to roads, and other regional characteristics to predict land use dynamics. This module uses result from Scenario Builder by providing data-driven insights into how different factors influence land use over time. There are two parts: Train Model and Simulate.
Policymakers can use this tool to explore the outcomes of various development, conservation, and land management strategies, enabling informed decisions to address challenges like deforestation and infrastructure development while balancing environmental sustainability and growth.
8.2 2. Usage
8.2.1 2.1 Workflow
Land Use Change Modelling using Dinamica module in LUMENS begins with data preparation, where users upload land cover maps from different time periods, along with a look-up table that defines land cover classes and land use types. These inputs are critical for calibrating the model. Next, users select relevant spatial variables such as elevation, distance to roads, and slope, which influence land use changes in the region. The model then trains by overlaying historical land cover data and selected variables to detect patterns in land use change. Afterward, users configure future scenarios by adjusting variables. The module runs the simulation based on these inputs, generating predictive maps and statistical outputs that show potential future land use changes and emissions.

8.2.2 2.2 Step-by-step instructions
The first step is to run Sciendo Train.
8.2.3 Step 1: Uploading Land Cover Data
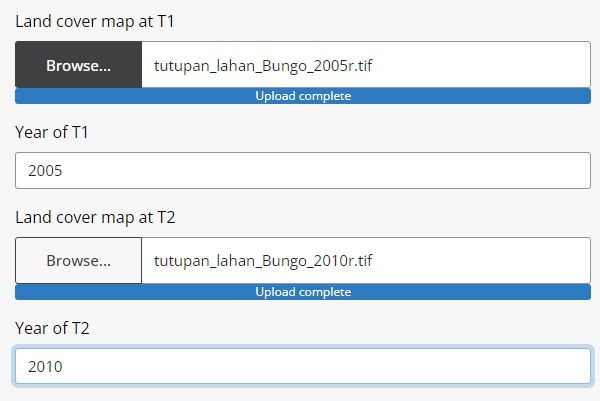
Upload Land Cover Map: Click the “Upload Raster” button. Select your land cover map (in GeoTIFF format) from your computer. Once uploaded, confirm the map appears in the interface.
Input Year: Input the corresponding year for the land cover map in the “Year” field. Once data for year 1 and year 2 have been uploaded, the input will look like this.
Upload Land Use Matrix:
Click the “Upload Land Use Matrix” button.
Select your land use matrix file, which defines transitions between land use categories. Confirm the matrix is correctly loaded. Your land-use matrix file should include the following details.
ID LC ID_Traj Trajectory color_palette 1 Hutan Primer 1 Undisturbed forest #005500 2 Hutan bekas tebangan kerapatan tinggi 2 Logged-over forest #009933 3 Hutan bekas tebangan kerapatan rendah 2 Logged-over forest #999900 4 Hutan Rawa Primer 1 Undisturbed forest #663300 5 Hutan Rawa Sekunder 2 Logged-over forest #996600 6 Hutan Rawa Primer Gambut 1 Undisturbed forest #999900 7 Hutan Rawa Sekunder Gambut 2 Logged-over forest #e68a00 8 Hutan Mangrove Primer 1 Undisturbed forest #80ffbf … Upload Planning Unit: Click the “Upload Planning Unit” button. Select your planning unit layer, which represents the spatial boundaries for analysis.
Add Factor or Folder Path
8.2.4 Step 2: Training the Model
Click the “Run Analysis” button. The system will process the inputs, using the land cover map, year, and land use matrix to identify land use transitions.
A progress bar will indicate the training status. Once complete, the results will be saved and available for use in the next step. Detailed results can be accessed in the “Output Directory”.
Upon completing Sciendo Train, use the results to run Sciendo Simulate.
8.2.5 Step 3: Simulating the Model
- Input data. Users will need to upload land cover map initial, planning unit, land use/cover look up table and raster cube (results from Sciendo Train) by clicking on Browse for each data input. Once uploaded, click open and ensure that the file has successfully been uploaded.
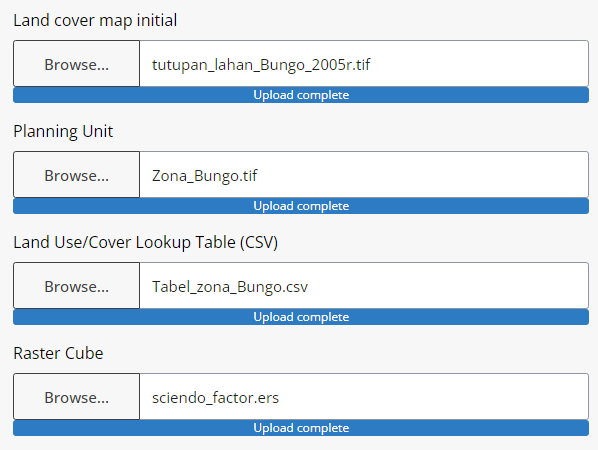
Input the number of repetitions you wish the model projects. For instance, in the example data we used data from 2005 to 2010 (5-year period). With this baseline, we can create projection repetitions per 5-year periods, respectively. In this example, for n number of repetitions, we can make n folds of 5-year periods. For projections until 2045, there are 7 repetitions. Projection repetitions uses the year gaps between T1 and T2 for its reps.
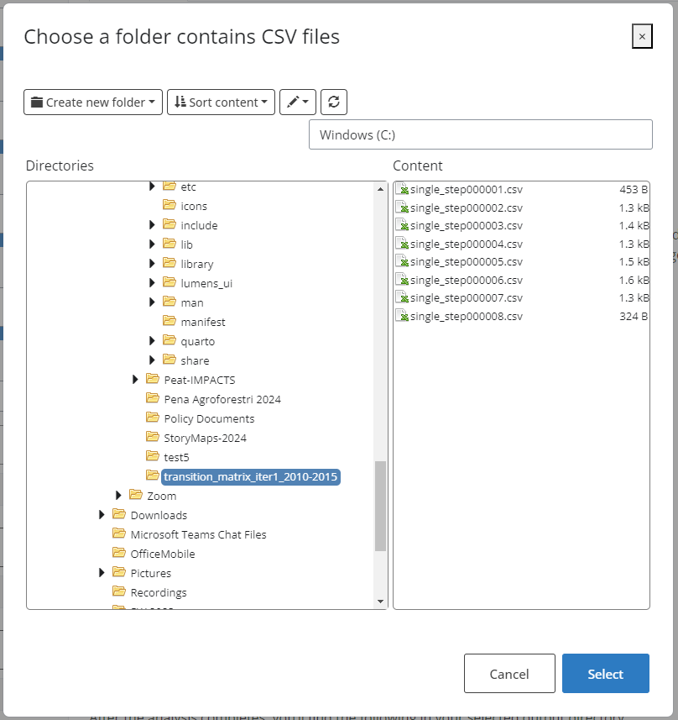
Insert the transition matrix folder. Select the folder that contains data from Sciendo Train in the form of CSV.
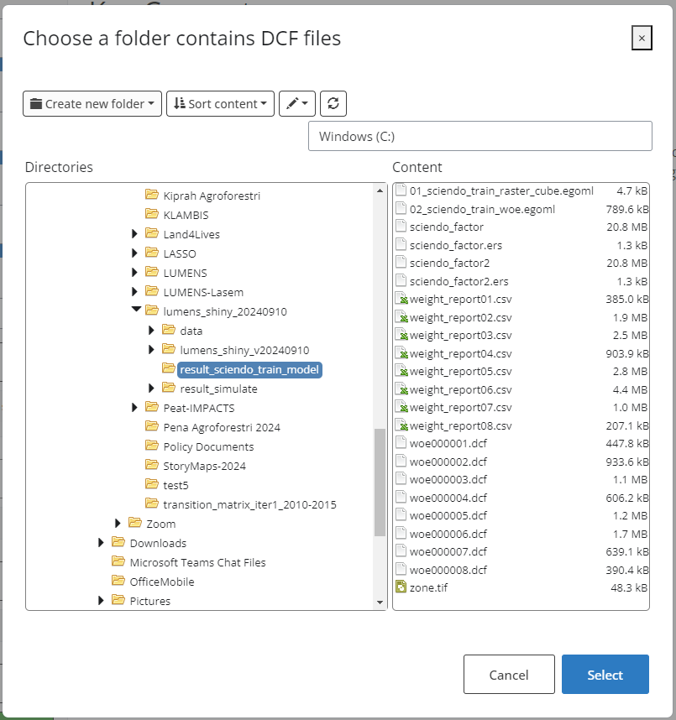
Input the folder path containing the weight of evidence results from Sciendo Train (in DCF format).
Select the output directory you wish to save your results. The chosen path will be shown in the bar below it.
Finalise the model by clicking on ‘Run Analysis’.
8.2.6 2.3 Tips
- For large data sets, the analysis may take some time to complete.
- Ensure that all input maps have the same extent and resolution.
8.3 3. Data Requirements
8.3.1 3.1 Input Data & Parameters
Input data for Sciendo Train is as follows.
| No | Data Name | Type | Format | Projection Requirements | Description |
|---|---|---|---|---|---|
| 1. | Land Use/ Cover Map (Time 1) | Categorical raster | GeoTIFF | UTM | A map classifying land use types for the start year. |
| 2. | Land Use/ Cover Map (Time 2) | Categorical raster | GeoTIFF | UTM | A map classifying land use types for the end year. |
| 3 | Planning units | Categorical raster | GeoTIFF | UTM | Categorical raster |
Results from Sciendo Train along with the following data are used for running Sciendo Simulate.
| No | Data Name | Type | Format | Projection Requirements | Description |
|---|---|---|---|---|---|
| 1. | Land Use/ Cover Map (Time 1) | Categorical raster | GeoTIFF | UTM | A map classifying land use types for the start year. |
| 2. | Planning unit | Categorical raster | GeoTIFF | UTM | A map of planning units over the study area. |
| 3. | Land use/cover look up table | Table | CSV | A table of the planning units used in the study. | |
| 4. | Raster cube | Raster | ERS | Raster cube results from Sciendo Train | |
| 5. | Transition matrix | Table | CSV | Table of transition rates for all land use transitions | |
| 6. | Weight of evidence | Table | CSV | Weight of evidence results from Sciendo Train for all planning units |
8.3.2 3.2 Example Datasets
Data sets used in this helpfile can be accessed at agroforestri.id/lumens-sciendo-trainsimulate
8.3.3 3.3 Data Acquisition
8.4 4. Outputs
8.4.1 4.1 Output Files
Sciendo Train
| File Name | Type | Description |
|---|---|---|
| sciendo_train_raster_cube | Raster | Map depicting changes in land use between the specified time periods. |
sciendo_factor |
CSV | Table showing the area of land that transitioned between each land use category. |
weight_report[suffix] |
CSV and DCF | Table showing the weight coefficients of land-use changes for each planning unit. |
report_[SUFFIX].html |
HTML | A report summarizing the analysis results with visualizations and tables. |
| zone | TIFF | Map of planning zones used in the analysis. |
Sciendo Simulate
| File Name | Type | Description |
|---|---|---|
sciendo_simulation |
EGOML File | |
luc_projection |
CSV | Table showing the projected area for all land use types for n-repetitions. |
landscape[suffix] |
GeoTIFF | Maps of the study area for years n. |
sciendo_report |
html | A report summarizing the analysis results with visualisations and tables. |
8.4.2 4.2 Report Interpretation
Sciendo Train
The module report for Sciendo Train consists of 4 main sections, namely Summary, Module brief description, Input data, and Results.
The results section presents the main information presented through this analysis, namely the weight of evidence report. This section displays the weights transition coefficients for all planning units.
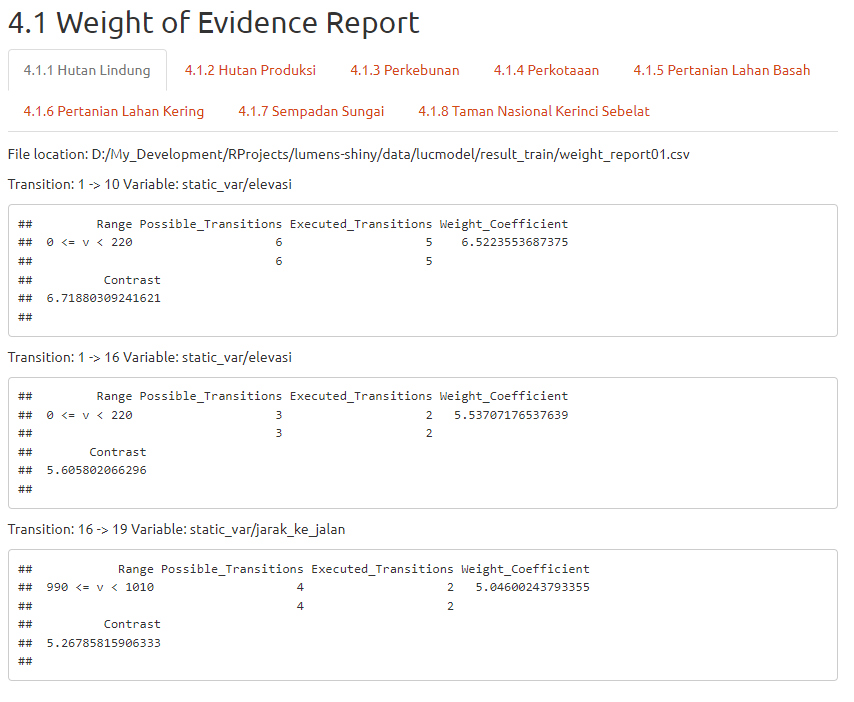
Here in the example data, there are 8 planning unit classes. From the example above, we can see that for planning unit class Hutan Lindung or Protected Forest there are 3 main land use transitions with significant transitions and highest weight coefficients, namely land use class 1 to 10, 1 to 16 and 16 to 19 with weight coefficients 6.5, 5.5, and 5.04 respectively. Each land use class transition has particular variables that most contribute to its transition, which in the example is indicated by variables elevation and distance to road. Additionally, users can also note the range of areas which the transition occurs as shown in the coloumn range.
For detailed information on the land use transitions weights, see the weights files in CSV found in your output directory.
Simulate
The report for Sciendo Simulate is presented in 4 sections: Summary; Module brief description; Input data; and Results.
Input data for this model is displayed first. This includes data input in the form of initial land use/cover map, planning unit and the respective land use/cover table.
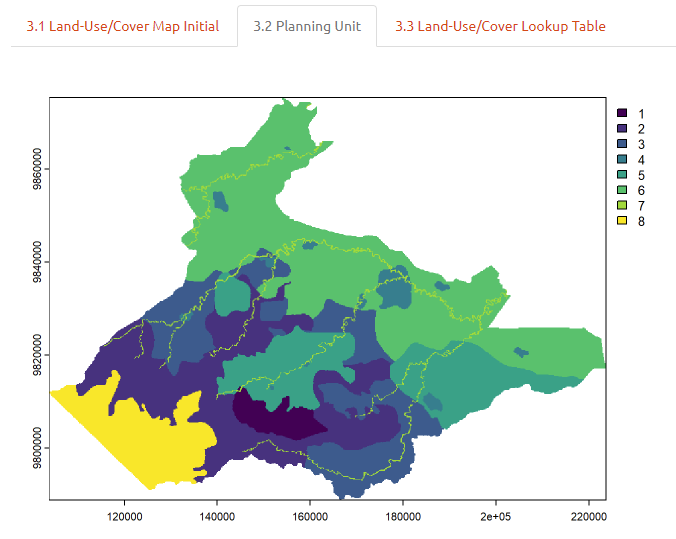
Projected land use changes can be observed in the form of its spatial maps for projected years T1, T2, T3, etc as well as in tabular form. Policymakers can use this information to locate the extent of land use changes for a given target year as an implication of the chosen scenario (BAU or alternative).
8.5 5. Theoretical Background
8.5.1 5.1 Model Description
Land use projection analysis is conducted by calculating the spatial dynamic transition possibilities of a given time period with the application of a logistic regression. By looking into transition possibilities, indicated by the results from Sciendo Train, the model produces input for land use projections in the form of transition weights. These weights form possible rules or spatial patterns that help predict and project land use changes for a given planning unit.
8.5.2 5.2 Key Assumptions
- The land cover maps accurately represent land use categories.
- Land use changes occur linearly over the analysis period.
8.5.3 5.3 Limitations
- This module does not account for gradual land use changes or changes that occur within a single land use category.
- Accuracy is limited by the quality and resolution of the input land cover maps.
8.6 References
Soares-Filho, Britaldo Silveira, Gustavo Coutinho Cerqueira, and CássioLopes Pennachin. 2002. “Dinamicaa Stochastic Cellular AutomataModel Designed to Simulate the Landscape Dynamics in an AmazonianColonization Frontier.” Ecological Modelling 154 (3):217–35. https://doi.org/10.1016/s0304-3800(02)00059-5.
