Regional Economic Projection
1. Description
The Regional Economic Projection Analysis module in LUMENS analyse the economic dynamics of a region, providing insights into comparative economic outcomes between the BAU (Business-As-Usual) and alternative scenarios. By analyzing land requirements and scenario data, this module assists policymakers in comparing different development pathways for sustainable land use, improving livelihoods, and optimizing land-use policies.
2. Usage
2.1 Workflow
This module processes input of the land requirement data and alternative scenario for the region of interest. Once the data are set, the module processes the input data, analyzing the comparison of BAU and scenario results in GDP, Output, Income and Labour
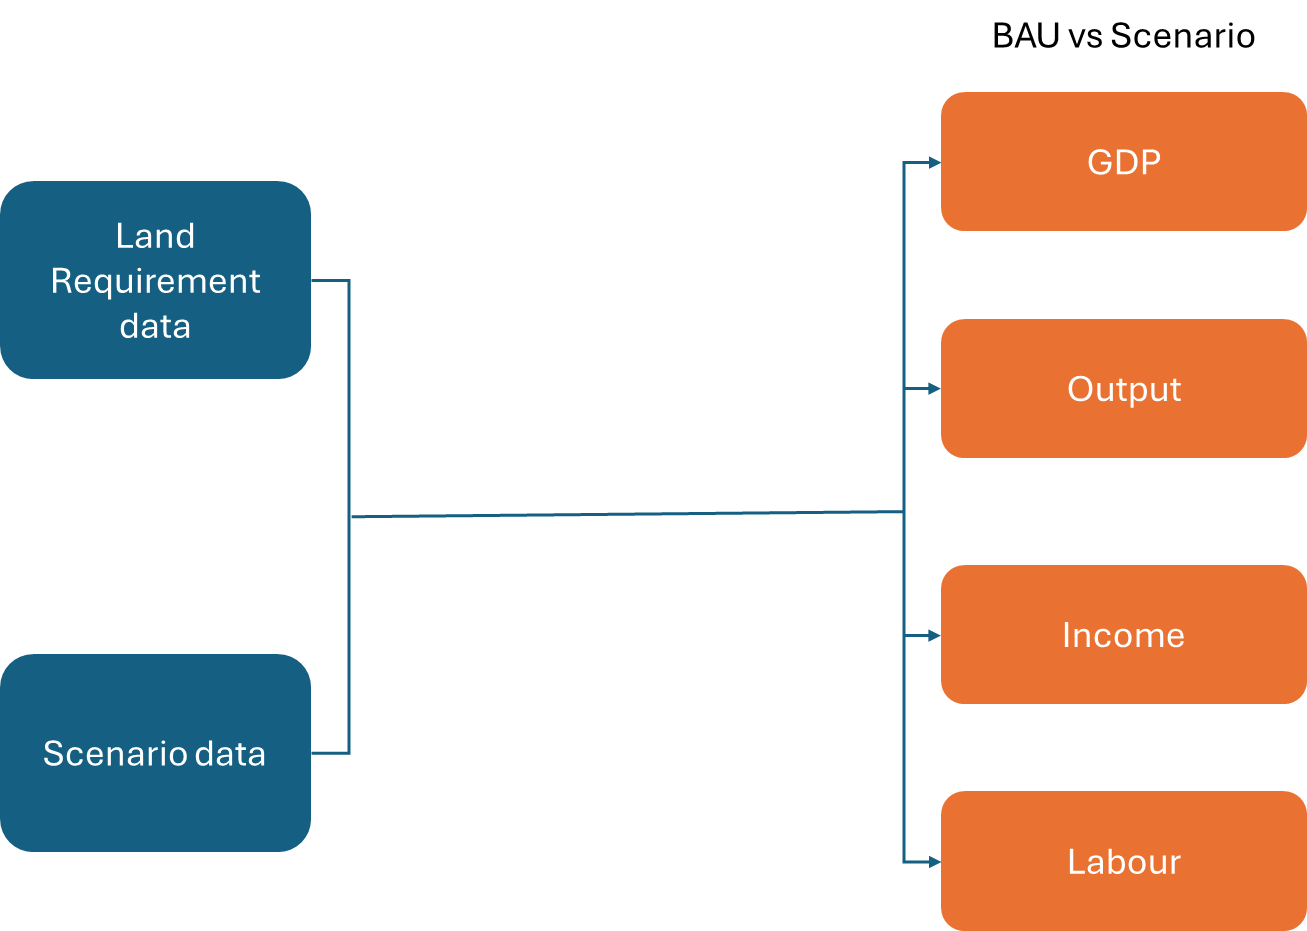
2.2 Step-by-step instructions
Step 1: Uploading Economic and Land Use Data
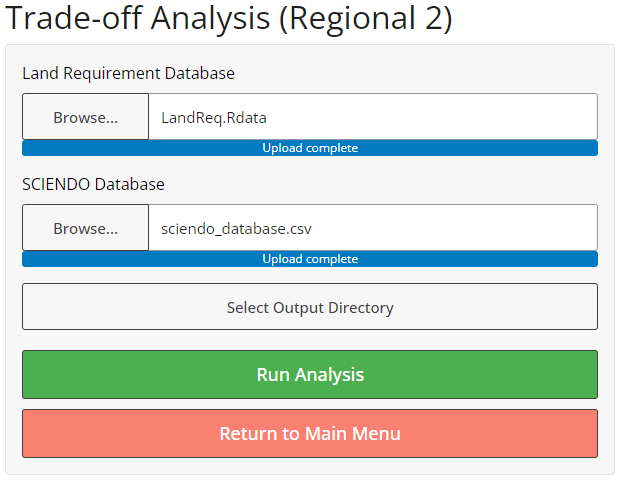
In this step, you’ll upload two data sets required for analysis: Land Requirement and Sciendo Database.
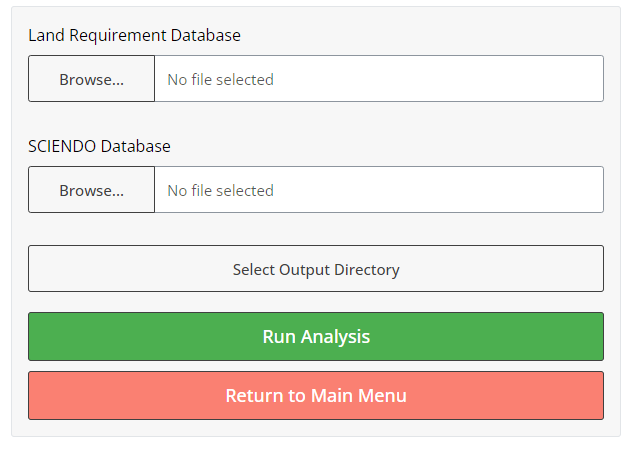
- Click the “Browse” Button in the tabs.
- Select your Table (CSV format), the land requirement database should be in vector format and SCIENDO database in CSV format.
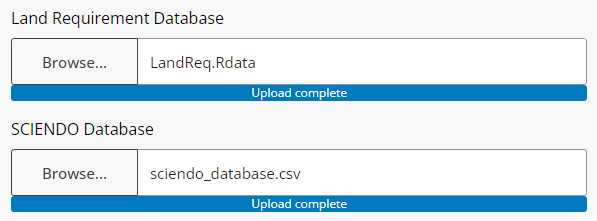
- When the data is successfully uploaded, it will appear as follows.
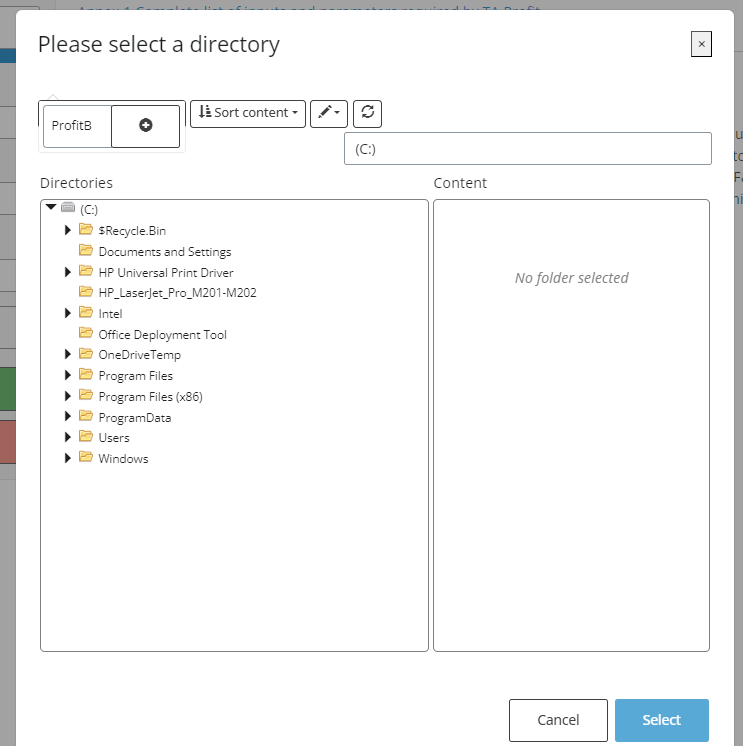
- Select Output Directory where results will be saved, Click ‘+’ to save and Select.
Step 2: Running the Analysis
Once all data is uploaded, run the analysis. Results will appear in the “Results” tab.
2.3 Tips
- For large datasets, the analysis may take some time to complete. Ensure that all input maps have the same extent and resolution.
3. Data Requirements
3.1 Input Data & Parameters
| No | Data Name | Type | Format | Projection Requirements | Description |
|---|---|---|---|---|---|
| 1. | Land Requirement Database | Vector | R data | N/A | Structured data that provides detailed information on the amount and types of land needed to support various economic activities, sectors, or development scenarios. |
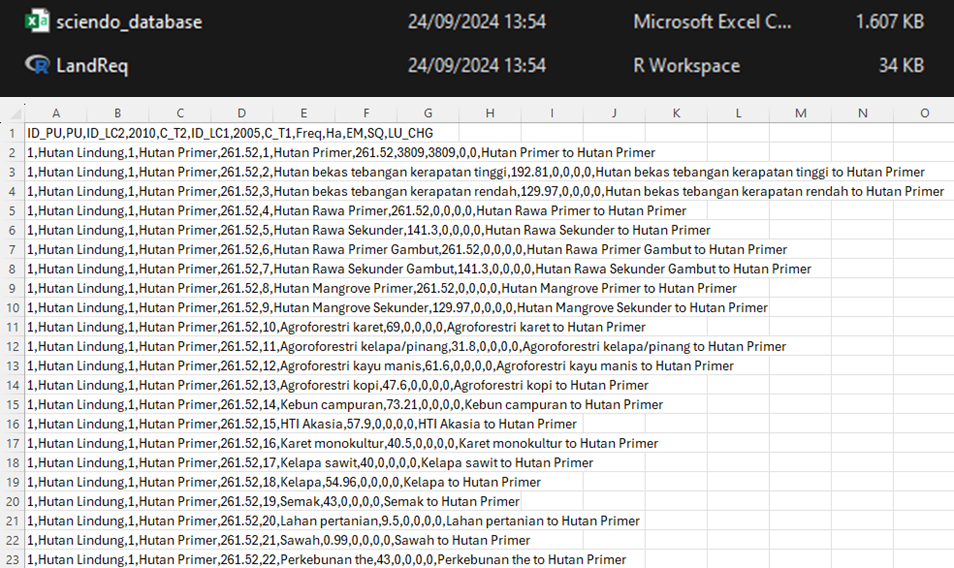
| 2. | Sciendo Database | Numerical | CSV | N/A | Simulation output for alternative scenario. |
Include rows for ALL required input data and parameters.
3.2 Example Datasets
Example data sets can be accessed in link.
3.3 Data Acquisition
Provide guidance on finding suitable data, linking to common sources if applicable. Example: - Land cover maps can often be obtained from link to data source. - For creating your own land cover maps from satellite imagery, consider using software such as link to software.
4. Outputs
4.1 Output Files
| File Name | Type | Description |
|---|---|---|
land_use_change_map_[SUFFIX].tif |
Raster | Map depicting changes in land use between the specified time periods. |
transition_matrix_[SUFFIX].csv |
CSV | Table showing the area of land that transitioned between each land use category. |
report_[SUFFIX].html |
HTML | A report summarizing the analysis results with visualizations and tables. |
| … | … | … |
Include rows for ALL output files, including the report.
4.2 Report Interpretation
This section will guide users on understanding and interpreting the content of the generated report, drawing insights from GDP table per sector and comparison graphs of GDP, Output, Income, and Labour.
1. GDP Table per Sector
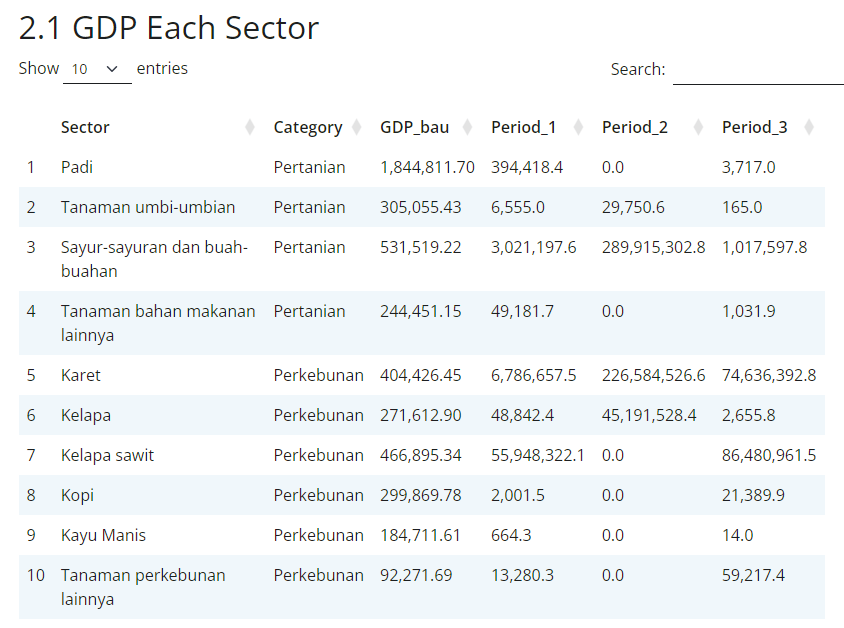
This table provides a sector-by-sector breakdown of the GDP under both the BAU and alternative scenario. The key points of interpretation include:
Sectoral Contributions: Identify which sectors contribute the most to GDP in each scenario. For instance, agriculture, manufacturing, or services might dominate in different scenarios.
Scenario Comparison: Compare the GDP contribution of each sector between BAU and the alternative scenario to determine how the alternative policy interventions affect the economic structure.
Growth Trends: Highlight which sectors are expected to grow or decline under each scenario. If certain sectors, like green industries, show significant growth in the alternative scenario, it reflects a shift towards sustainable economic activities.
In the alternative scenario, we observe a XXX increase in the GDP contribution from agriculture, while the BAU scenario continues to rely on mining sector, indicating the potential for a more sustainable economic pathway.
2. GDP Comparison Graph
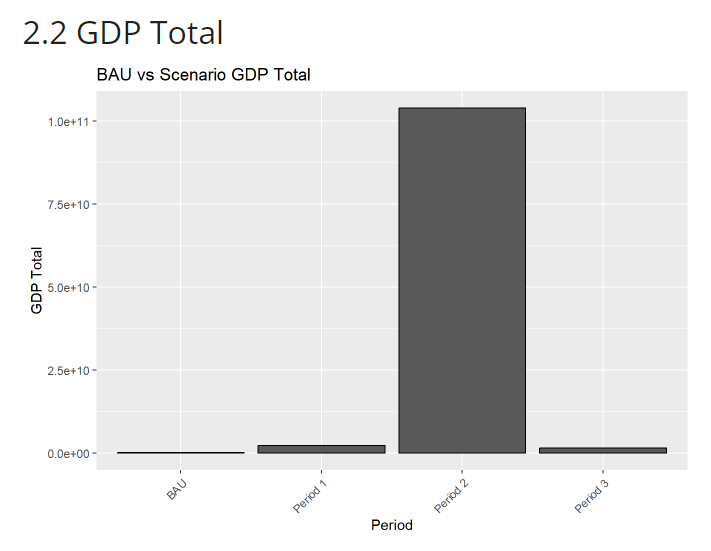
This graph compares overall GDP growth between the BAU and alternative scenarios over the analysis period. Key aspects to interpret include:
Economic Growth: Look at the rate of GDP growth in both scenarios. The alternative scenario may show slower growth initially but could exhibit more stability in the long term if it is aligned with sustainable development goals.
Sustainability Trade-offs: Compare whether the alternative scenario sacrifices short-term GDP growth for long-term sustainability. If BAU shows higher immediate growth, this could come at the expense of environmental degradation or social inequalities.
Key Inflections: Identify points where the alternative scenario may outperform BAU, suggesting a shift in economic trajectory due to sustainable policies.
The GDP growth under the BAU scenario is higher in the first five years, but the alternative scenario overtakes it by the third period, indicating that sustainable practices lead to more resilient, long-term growth.
3. Output Comparison Graph
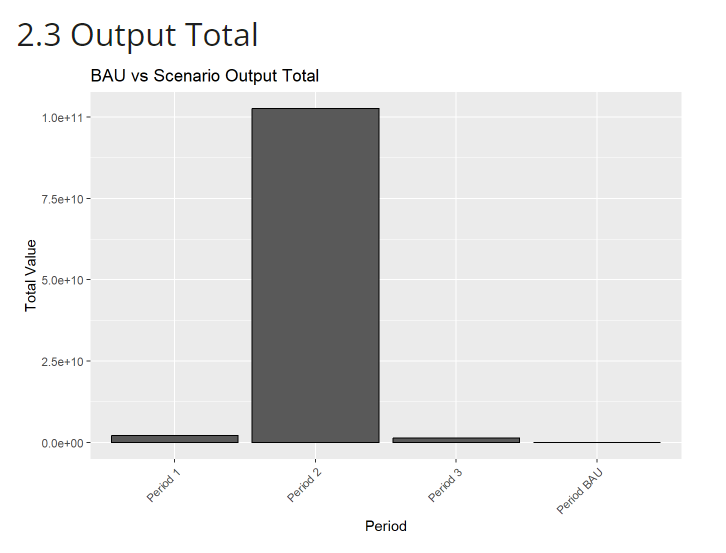
The output comparison graph shows the total economic output generated by different sectors in both scenarios. Key interpretations include:
Sectoral Output Changes: Analyze which sectors experience significant output shifts between the scenarios. For example, in the alternative scenario, you might see increased output from eco-friendly industries, renewable energy, or sustainable agriculture.
Diversification of Output: The alternative scenario may lead to a more diversified economy if policies promote new sectors, reducing reliance on a few dominant industries.
Economic Efficiency: If the alternative scenario achieves higher output with less resource consumption (e.g., land, water), it may indicate improved economic efficiency.
The alternative scenario results in a 25% increase in output from the sustainable agriculture sector, while the BAU scenario remains dependent on extractive industries, reflecting a more diverse and resilient economic base in the alternative pathway.
4. Income Comparison Graph
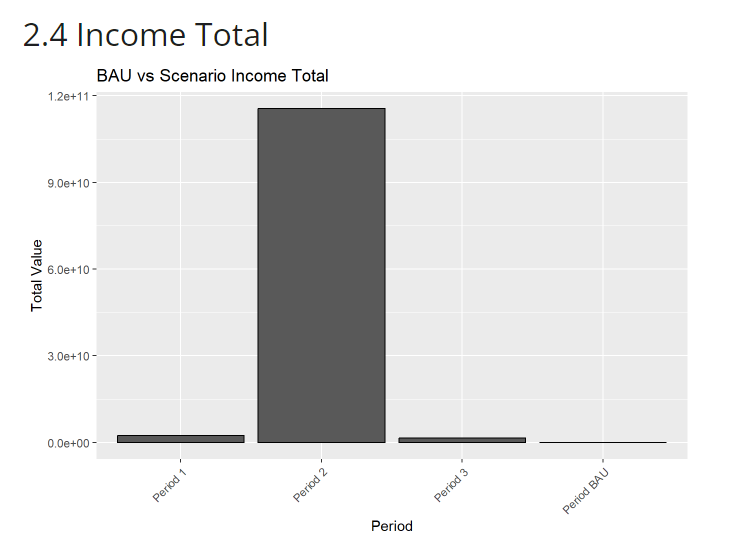
This graph reflects the distribution of income across sectors and scenarios, highlighting impacts on livelihoods and equity. Interpretations include:
Income Growth by Sector: Analyze how incomes change in both scenarios, especially for sectors with a large labor force like agriculture or manufacturing.
Equitable Income Distribution: The alternative scenario may lead to more equitable income distribution if policies are geared toward inclusive economic growth (e.g., through job creation in sustainable industries).
Sectoral Shifts: A shift in income towards green sectors in the alternative scenario could indicate that sustainable economic policies are creating new, higher-paying jobs in emerging sectors.
Incomes in the alternative scenario show a 20% rise in the agricultural sector, while the BAU scenario continues to see income concentration in extractive industries, indicating a fairer distribution of wealth and better livelihood opportunities in the alternative scenario.
5. Labour Comparison Graph
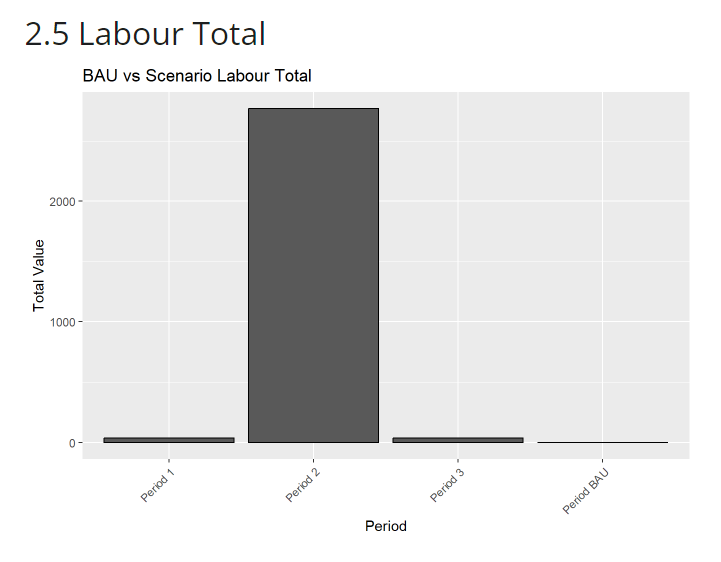
This graph provides insight into employment trends in both scenarios. Key interpretations include:
Employment Growth: Compare overall employment growth between the scenarios. The alternative scenario may promote job creation in emerging sectors like sustainable agriculture.
Sectoral Employment Shifts: Identify which sectors gain or lose jobs in each scenario. The alternative scenario may show a shift away from resource-intensive sectors towards green sectors.
Labor Productivity: A scenario where labor demand decreases but output increases may indicate higher productivity, which could signal more efficient land and resource use.
Interpretation Example: The alternative scenario shows a 10% increase in labor demand in the agricultural sector compared to BAU, suggesting that the shift towards sustainable development is also creating new employment opportunities.
5. Theoretical Background
5.1 Model Description
The Regional Economic Projection module compares the economic outcomes between the Business-as-Usual (BAU) scenario and an alternative (ALT) scenario, typically aimed at promoting sustainable land use and green economy initiatives. The module utilizes projection algorithms that estimate future economic indicators such as GDP, output, income, and labor, based on land use dynamics and sectoral activity. The model integrates both economic and environmental data to project the effects of land-use decisions and policy interventions.
Scenario Inputs: Each scenario (BAU vs. ALT) is defined by different assumptions regarding land use, resource management, and policy measures. These inputs are processed to forecast economic outcomes over a specific time horizon.
Economic Projections: The module assesses sectoral performance by estimating indicators such as GDP, output, income, and labor for each sector. A comparative analysis highlights the impact of sustainable policies versus a continuation of current practices (BAU).
5.2 Key Assumptions
Key assumptions in the model are as follows:
The model assumes that the land-use and economic sector data (such as current land cover, resource availability, and sector productivity) accurately represent real-world conditions.
The model assumes that land-use changes occur in a relatively linear fashion across the analysis period. Major shocks or nonlinear shifts in land use, such as natural disasters or rapid technological advancements, may not be captured fully.
5.3 Limitations
The module limitations and potential sources of error/uncertainty are as follows:
- The accuracy of projections is highly dependent on the quality of input data, particularly land-use maps and sectoral economic data. Inconsistent or outdated data could result in unreliable or skewed outcomes. High-resolution and up-to-date land-use maps are critical for precise scenario analysis.
- The model simplifies land-use dynamics and may not account for gradual or complex changes within land-use categories.
References
@article{dewi2023integrating, title={Integrating relational and instrumental values of nature in planning land use for multiple ecosystem services (LUMENS): tools and process}, author={Dewi, Sonya and Mulia, Rachmat and Johana, Feri and Ekadinata, Andree and van Noordwijk, Meine}, journal={Current Opinion in Environmental Sustainability}, volume={64}, pages={101333}, year={2023}, publisher={Elsevier} }
